Chart Lab: USC Women's Volleyball Stats
This webpage explores USC Women's Volleyball Stats from the 2025 season. Specifically, it compares the performance of the teams three outside hitters through different methods of visualization. This analysis could be valuable to coaches when making decisions about playing time, useful to competing teams who are conducting opposition research, and interesting for fans to explore.
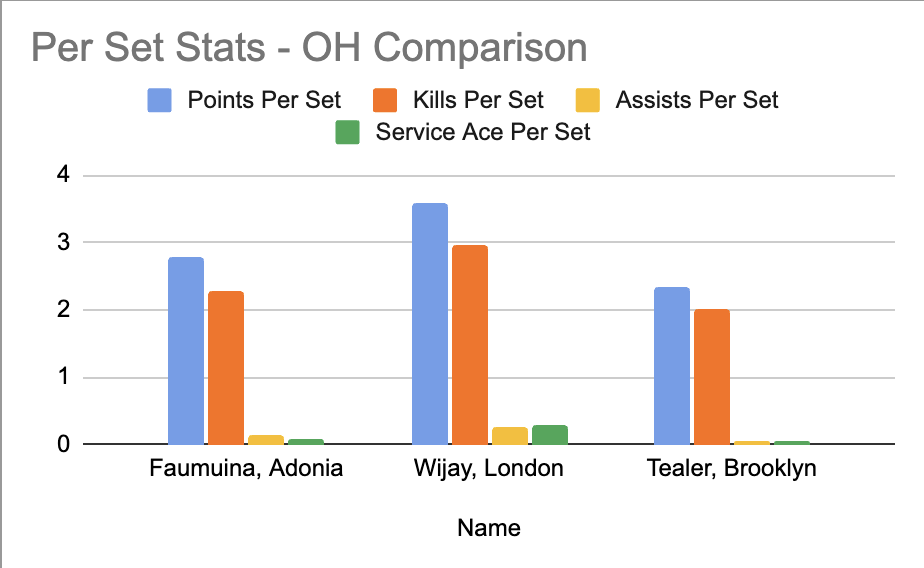
This chart plots the players on the x-axis and their averaged game stats on the y-axis. This figure demonstrates that London Wijay has performed the best and most consistently over all of the season games, while Faumuina Adonia and Brooklyn Tealer rank second and third respectively. This information can be used to determine playing time and positions. Based on this chart, I would recommend that Wijay continue to play the OH1 position, and designate the OH2 position to Faumuina.
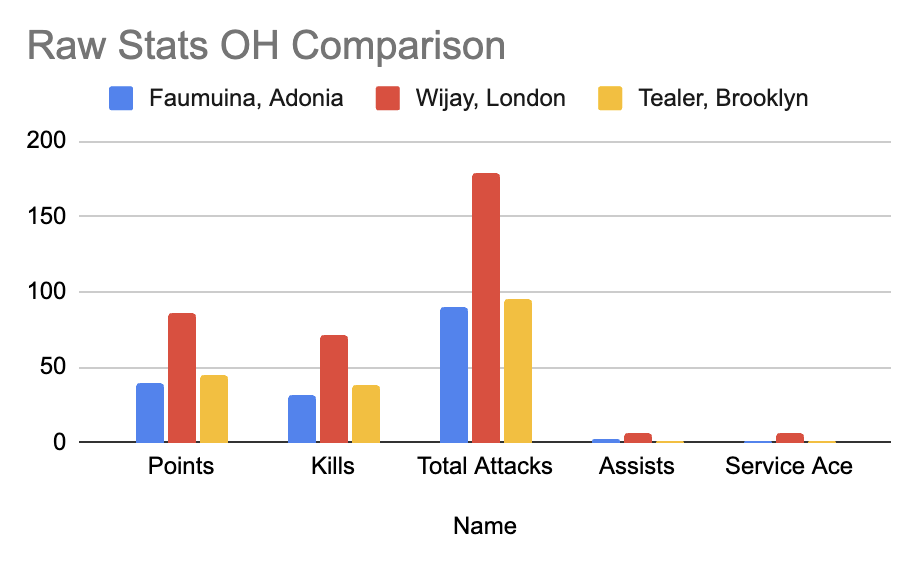
In a change from the previous chart, this figure plots the stat categories on the x axis and the players' performance in each category on the y-axis. This choice results in groupings that allow for easier analysis of performance within specific categories. For example, a coach could look at the service ace category to determine who they should sub in for service. However, the use of raw stats may still not paint a complete picture of athlete's abilities, as it does not account for amount of playtime (i.e. players with more playing time have greater raw stats) and loss of games played due to injury.
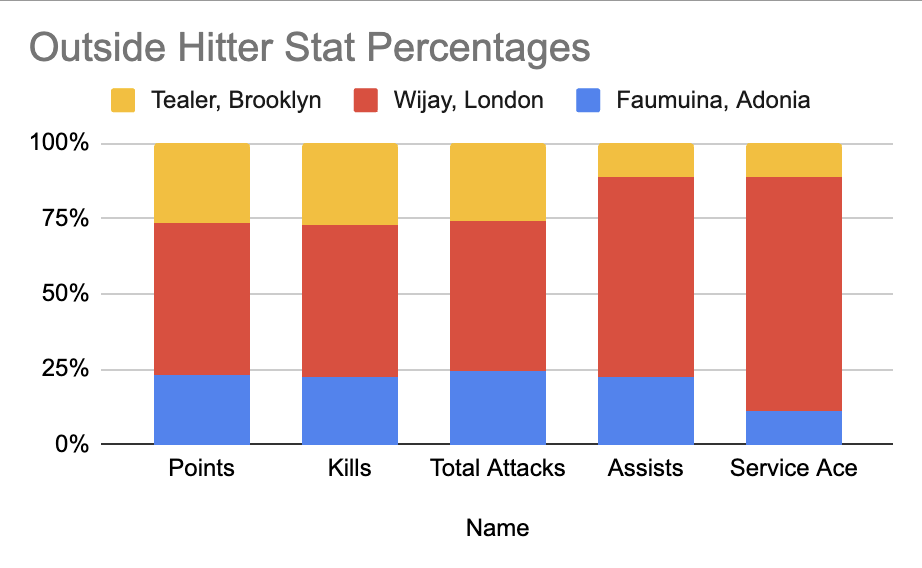
This chart is formatted similarly to the figure above, however it displays athlete performance as a stacked barchart rather than side-by-side data points. This chart can be leveraged in a similar way as the chart above, however, it allows for easier visual comparison.